Use Newsy Numbers to Teach Media Literacy
 Some years ago a survey revealed the news themes that relied most on numbers to generate reader interest.
Among top stories were those about the monthly Consumer Product Index, the stock market ups and downs, and seasonal sports statistics. If you’re a math educator, perhaps you’ve already used some of these data sources, or others, to hook your students with “real world applications.”
As a media educator, I found that list of the most “number-focused” news stories to be lacking in one major area: the media itself.
It might help to know that I previously worked as a broadcast journalist at various TV stations across the country. I was not aware of “ratings” as they applied to my local news departments, but I was very aware of the national ratings for television programs and series. A large audience for a program at 10 p.m. would usually mean viewers would stick around and watch the news at 11 p.m.
I created a website entitled Math In The Media as a way to encourage math educators and students to think more deeply about television ratings, who generates them and how they are used.
Television ratings – Do the math
Media literacy is first and foremost about “critical inquiry” — asking questions. So an appropriate first question for math students to consider might be: who generates TV ratings? Every week, Nielsen (the major ratings company in the US) releases its list of the top 10 rated network TV programs from the previous week. You can find it here.
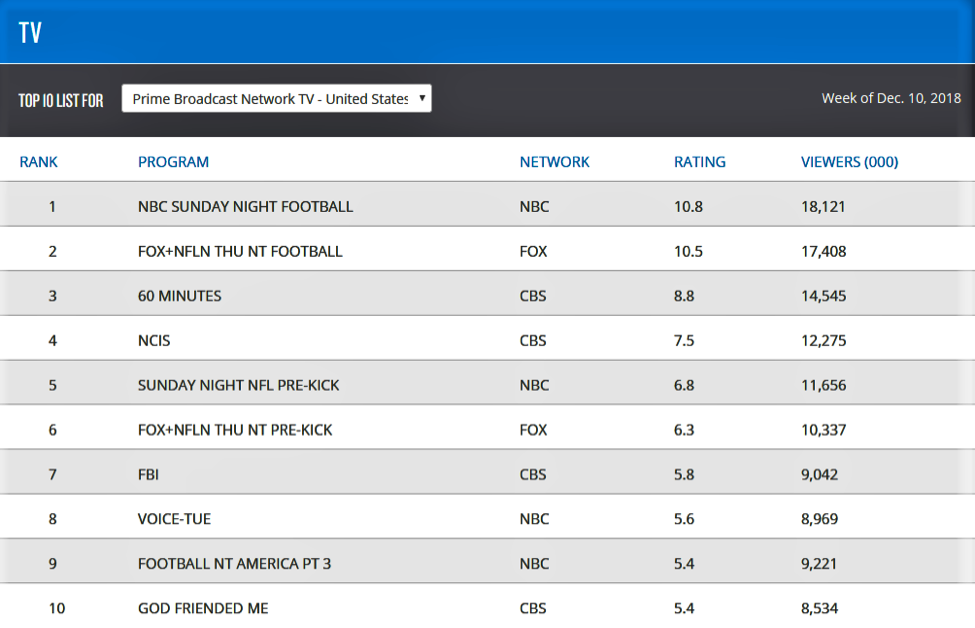
For purposes of this blog post, I snagged the top 10 from one week in December 2018. (see below – click to enlarge). You could print it out for students or simply project it on a screen as you begin to introduce your students to the world of network television ratings.
The first thing you might introduce your students to is the rating number itself. They can probably deduce that the higher the rating, the larger the viewing audience. But what exactly is “a rating”? What does it represent?
A rating is a percentage. According to Nielson, “Ratings are the percentage of (all) TV homes in the US tuned into television.” (Source) Notice, in the chart above, that NBC Sunday Night Football had a rating of 10.8. So, more than 10% of all homes in the US are tuned to NBC.
Here is how it is determined: “There are 119.6 million TV homes in the U.S. for the 2017-18 TV season (Nielsen’s National Television Household Universe Estimates). The number of persons age 2 and older in U.S. TV Households is estimated to be 304.5 million. A single national ratings point represents 1% of the total number. “ (Source: Wikipedia)
In the case of the NBC Sunday Night Football 10.8% of the total TV homes translates to an audience of just over 18 million viewers. That’s huge.
The success of NBC’s broadcast of Sunday Night Football means that the Peacock Network can charge advertisers a premium price for the commercials aired during the game. During the fall 2018 annual survey of ad prices, SNF was charging an average of $665,677 for a 30-second commercial – two-thirds of a million dollars. (See the blog post I wrote about that here.) Variety magazine, a trade publication, places the exact cost of that one spot at closer to $730,000. (Source)
You might have your students work in teams to calculate how many ad seconds are broadcast during an NFL game and have them calculate the haul NBC receives each week.
Who Pays Attention To Ratings?
One of the key concepts of media literacy is that most media exist to make money.
How do TV stations make money, you might ask your students? Commercial TV is designed to sell ad time during TV shows that the desired audience is sure to be watching. (You might ask your students which TV shows they watch and have them create a list of some of the advertisers that try to reach them.)
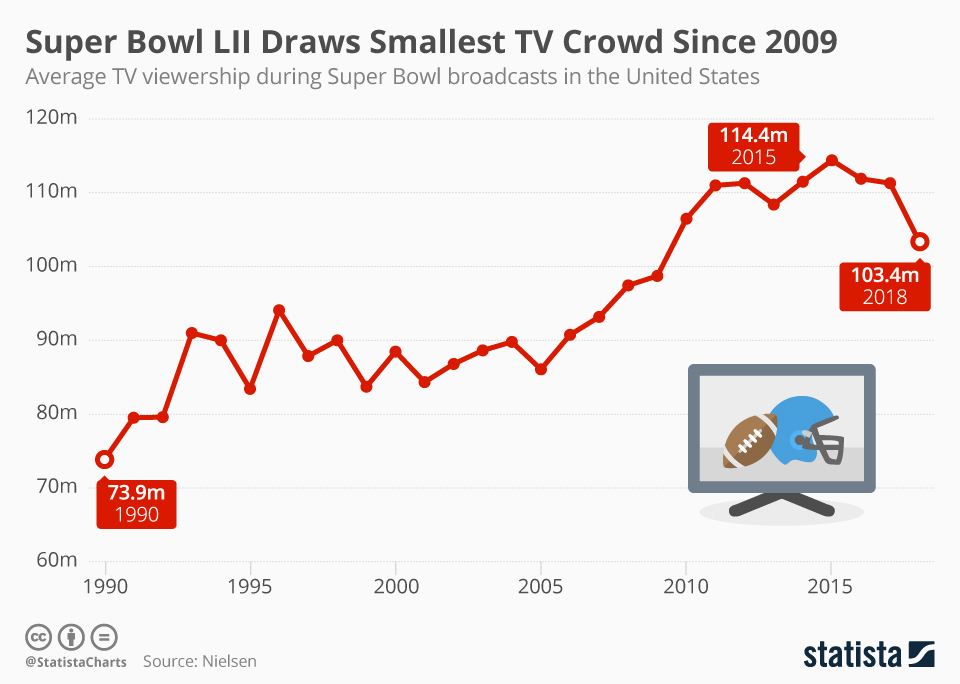
Super Bowl audience trends might make for interesting data analysis and discussion. What are some factors that might help account for the rise and recent fall of audience size? Generational? Availability of other options? Teams? Rise of streaming media? (Source)
NBC certainly makes money by broadcasting Sunday Night Football and delivering that huge audience to its advertisers, who are paying enormous sums to make sure the audience is exposed to their product or service.
Who else pays attention to those ratings? For sure, the advertisers are carefully scrutinizing those weekly numbers to insure they have the “reach” they need. Reach is an advertising word that “refers to the total number of different people or households exposed, at least once, to a medium during a given period.” (Source) So if, for example, the rating (and audience) should decrease for a particular show, the advertiser will certainly want to pay less, since the program is reaching fewer eyeballs, brain impulse centers, and pocketbooks.
Some recommended activities
► Have your students track the same TV show during a specific time period (month, year) and create an infographic chart indicating the changes. Have them calculate the percentage change in the ratings during that time period.
► The annual Super Bowl game attracts one of the largest audiences (and thus highest ratings) in TV history. Task your students with researching the ratings for all Super Bowls of the past 10/20 years, as the price for a 30-second ad each year. How have the ratings/prices changed over time?
► Ask your students what their favorite network TV programs are, and after displaying them for all to see, task them with categorizing the entire list by genre. Now, using the Nielson Top TV Programs of the week, found here, ask them to identify the top-rated programs in each genre. Next, ask them to categorize the top 10 programs by TV network. Can they make any conclusions based on their findings? Repeat the activity in three months and compare results from each sampling. (Note that you can choose lists for network, cable, and syndicated shows like Jeopardy.)
► Consider contacting the sales department at your local TV network-affiliated station. Students can inquire about the cost of placing a 30 second commercial in any of the Nielsen Top 10 Rated programs of the week. Have them create a chart indicating the shows that command the highest prices for a 30-second spot and those that are the least expensive.
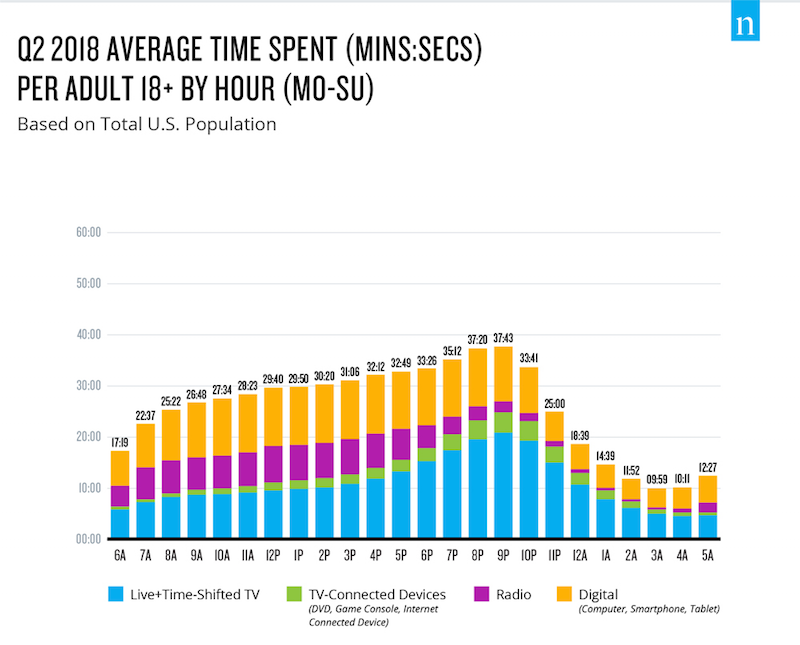
A big picture view of how the total U.S. audience interacts with various media throughout the day. (Source)
► The Nielson website can be an excellent source for other numbers-related activities that will interest students at the middle level. You may have noticed that Nielson ranks “most-anticipated videogames” and aspects of social media usage as well. There are also interesting summaries on topics like the “retro” surge of Over the Air (OTA) antenna use in homes as viewers look for cheaper alternatives to get local channels while subscribing to more internet streaming services. And quarterly profiles like the total audience across all media devices.
Educators are keenly aware that using real life examples in their instruction helps students make important connections between the curriculum and their own lives. Involving students in real life math examples is just another way educators can engage them in relevance and media literacy.
More Resources
Tying TV Advertising to Media Literacy Lessons (MiddleWeb)
Math In The Media (Media Literacy Clearinghouse)
How Do TV Ratings Work? (student-friendly text + video; How Stuff Works)
How Much Does TV Advertising Really Cost? (Houston Chronicle)
TV Broadcast Ratings Lesson (Media Smarts Canada)
An “Understanding Television” Lesson Plan (Discovery)

