Use Inquiry Charts to Boost Student Research
By Lisa Baldwin, Eric Chavez, Cassie Nettle and Sunday Cummins
When you ask students to research a topic, what happens? Chances are some students will struggle. Why? Maybe the topic they have chosen is too broad. Maybe they are not sure how to identify strong sources of information. Maybe they are not sure how to begin taking notes.
So what can we do? Our team spent the last two years using Inquiry Charts or i-charts (Hoffman, 1992) to help students navigate the pitfalls of research and, more importantly, develop agency as researchers and knowledge builders.
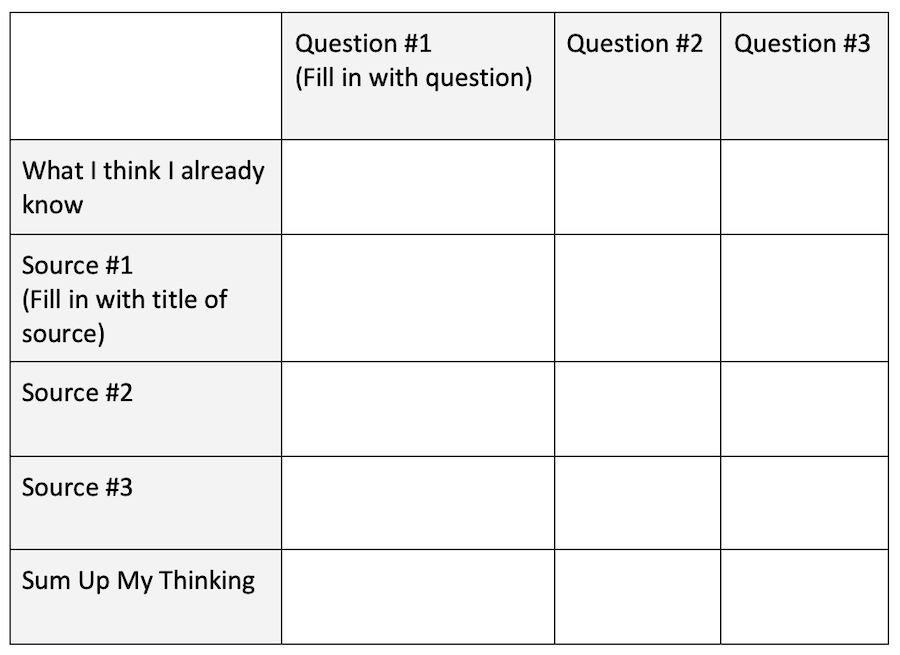
An inquiry chart is a simple way for students to organize their notes as they learn from each source in a set (Cummins, 2018). In the figure below, you can see a blank (minimized) inquiry chart. When completed, the questions for research are listed across the top and the sources of information are listed down the left hand column.
The first “source” of information is the student’s background knowledge or “what I think I know about this topic” which helps students reflect on learning as they learn and take notes. For the last row, students look down a column of notes, synthesize and then make notes about the big ideas they have learned or why what they have learned is important.
Minimized Inquiry Chart
 This is harder than it looks, though. Identifying questions that are just right – not too broad, not too vague – takes some skill. Additionally, students have to locate sources that are helpful. In today’s visual-culture-driven world, this should include video and graphics as well as traditional text. Then as they read, listen to or view a source, they have to do the following:
- notice relevant details,
- make sense of those details,
- paraphrase what they’ve learned,
- contrast this information with what they have learned in other sources,
- figure out how to put their learning in brief bulleted notes (not sentences).
This may feel like a lot for some of our students, and this list doesn’t include using the inquiry chart to help them communicate their learning overall through some sort of writing, model development or oral presentation. (We will discuss this latter topic further in a follow-up article.)
Through our work with small groups using inquiry charts to research a variety of topics, we have identified a few key instructional practices that are helpful. They include:
1. Initially identifying the questions for students in advance so they can develop a repertoire to draw from when they identify their own questions for research later;
2. Develop a set of sources as a model for students to think about when they begin to locate their own sets of sources;
3. Engage students in guided practice on how to think across sources (and make notes).
Identify the research questions for students.
The questions you share with students become part of a repertoire they can draw from. For example, with one set of sources on the Civil Rights movement, Cassie’s students researched the following three questions:
- How were people segregated?
- What was the impact of segregation?
- How did people fight for their civil rights?
Eric worked with a group studying noise pollution researching these questions:
- How do humans contribute to noise pollution?
- How does noise pollution impact animals?
- How does the setting of the noise pollution make the problem different?
All of these can easily be referred to (mentally) when students move on to research their own topics. An alternative early on might be to for the teacher to generate two of three research questions and support the students in generating the third as a group.
How do you generate strong questions for students? This requires a confession. We usually choose a strong complex source at the start and then generate the questions based on the information in that source.
This way we know that all three of the questions will be answered in at least one source. When you begin to release responsibility to students for generating their own questions, we recommend that you teach this strategy to your students as well.
Create a strong set of sources as a model.
When we first introduce inquiry charts, we also create the set of sources for students. We choose a variety of types of sources – videos, graphics (e.g., maps, charts, diagrams), and traditional texts.
Incorporating short videos (or clips of longer videos) into the set of sources can serve two purposes. You can use the video to draw students’ interest at the beginning and then return to that video as a source of information during the research process. Graphics are visually appealing and can add additional layers of meaning that traditional texts might not.
Here’s an example of using video and graphics in social studies:
When Lisa’s students studied the eruption of Mount Vesuvius that buried the city of Pompeii in 79 A.D., she began with a short animation of the eruption and the effects because she knew her students were not familiar with this event and might need support in visualizing what happened as well as how quickly it happened.
The students began their inquiry charts as they watched and learned from a second video which included details about the tremors occurring four days before the eruption, people observing from across the Bay of Naples, ash shooting 10 miles up in the air, and a fourth pyrotechnic discharge traveling towards Pompeii at over 200 mph.
Then Lisa introduced a diagram of the volcano so they could discuss the vocabulary and process of an eruption. They were also able to see that there were other cities close to Mount Vesuvius. The article, which also featured a map, included information about the volcano and a firsthand account. The students closely read the firsthand account, in particular, to identify more relevant details for their inquiry charts.
Engage students in guided practice focused on thinking across sources.
Before students can take notes about what they’ve learned from a source, they need to actually read, listen to or view the source and make sense of it for themselves. We spend time focused on comprehension before we help students take notes in their inquiry charts.
This may include teaching a strategy like explode to explain or the coding strategy to support students in making sense of the source. THEN we think about what we’ve learned from the source that’s relevant to the three questions. (In truth, the questions are always in the back of our minds. It’s part of how we monitor for meaning, right?)
Students may be able to fill in the blanks for each question pretty easily, but we want them to avoid thinking about what they are learning source by source. Instead we need them to be asking questions like the following:
• How does what I’ve learned in this source contrast with what I’ve learned in the other sources?
• Is there new information that builds on to what I’ve already learned?
• If there is information that is similar, can I just make a note about that in my inquiry chart or do I need to write the information all over again?
We try to present these questions to students as they think about what to include on their inquiry chart. We think aloud about what we do as readers of multiple sources, modeling and filling in information from the second source on our own chart.
Eric’s students read two articles about insect infestations. After reading an article about the citizens of Kenya battling large swarms of desert locusts (Morjaria, 2020), Eric introduced an article about Florida’s attempts to eradicate the giant African land snail (Levy, 2022). These are the first few sentences of this second article about Florida’s problem:
The giant African land snail (GALS) has returned to Florida for a third time. The invasive species was first detected in the state in 1969. It took seven years and $1 million to get rid of them.
This short excerpt lends itself to an immediate connection to previous learning about Kenya’s struggle to rid itself of the locusts, making it perfect for a think aloud and quick release of responsibility. After synthesizing the information in both articles, one of Eric’s students summed up their thinking by writing, “In all types of places and cultures people are facing similar struggles. Even here we have to fight this. We should work on solutions.”
Do the work for yourself
One last tip – fill in the inquiry chart for yourself before you teach. This will make teaching easier. Getting to know the articles and how they are related (or not) can give you an idea of when you might need to think aloud for students, when you can easily release responsibility and when you might need to step in to provide more support. In the end, student agency is the goal.
References
Cummins, S. (2017). “The Case for Multiple Texts.” Educational Leadership.Vol. 74, No. 5.
Cummins, S. (2019). Nurturing Informed Thinking: Reading, Talking and Writing Across Content-Area Sources. Portsmouth, NH: Heinemann.
Hoffman, J. V. (1992). “Critical Reading/Thinking Across the Curriculum: Using I-Charts to Support Learning.” Language Arts 69 (2): 121-127.
Here’s a link to both articles in this I-Charts series.
Lisa Baldwin is a 4th grade teacher at Topping Elementary, North Kansas City Schools. She is a graduate of Avila University and holds a master’s degree in Curriculum and Instruction. In 2017 she achieved National Board Certification in Generalist/Middle Childhood.
Eric Chavez is a 4th grade teacher at Topping Elementary School, North Kansas City Schools. He is a graduate of California State University of Long Beach and University of Missouri Kansas City. He holds a master’s degree in Curriculum and Instruction Design.
Cassie Nettle is a 4th grade teacher at Topping Elementary, North Kansas City Schools. She is a graduate of Northwest Missouri State University with certification in Elementary Education and Middle School Mathematics. She holds a master’s degree in Curriculum and Instruction from Peru State College.
Sunday Cummins, Ph.D., is a literacy consultant and author and has been a teacher and literacy coach in public schools. Her work focuses on supporting teachers, schools and districts as they plan and implement assessment driven instruction with complex informational sources including traditional texts, video and infographics. She is the author of several professional books, including Close Reading of Informational Sources (Guilford, 2019). Visit her website.
